Dynamic
fleet mission planning
This video
illustrates our dynamic fleet mission planning method, for
autonomous underground mining operation. The video
shows, at 20x the actual speed, the first hour of a four-hour
shift in the mine shown in the figure below.
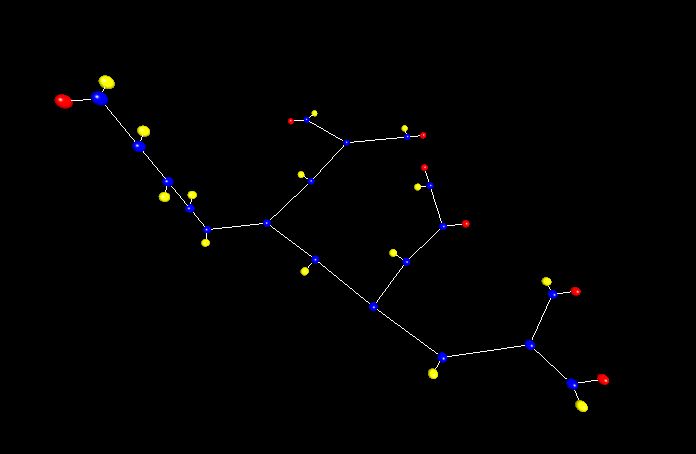
Note that the map is
topological. For example, the vertical section in the left-hand
side of the map would, in reality, be a spiralling path leading
down to the lower levels of the mine. The red nodes are terminals.
The left-most red node is the offloading terminal, where vehicles
dump material for crushing, whereas the other red nodes are
loading terminals deep in the mine, where vehicles pick up
material. The yellow nodes are pause nodes where (outgoing)
vehicles can stop in order to let another vehicle pass. The blue
nodes are transit nodes, where a vehicle has a choice between (at
least) two different directions. Note that only outgoing (empty)
vehicles are allowed to stop at pause nodes in this way: Incoming
(loaded) vehicles always drive along the shortest path towards the
offloading station (however, in cases where the offloading station
is occupied, incoming vehicles are allowed to stop
temporarily at a non-occupied pause node near the offloading
station.
Vehicles that reach
a terminal (either a loading site or an offloading site) can
request re-optimization, once they have completed their
stationary activity (loading or offloading). At that point, the
optimizer generates a new mission for the vehicle in question,
while also (potentially) modifying the missions of the other
vehicles. Thus, the planning method must be able to handle the
fact that vehicles move during optimization and must
make sure to maintain causaility, by only making changes in
those parts of the missions that lie beyond the end time of the
optimization procedure.
Note also that the video has been speeded up by a factor 20. The
actual traversal times are on the order of 7 - 15 minutes. For
this rather small mine map, with a single off-loading station, 4-5
vehicles is close to the upper limit of what is reasonable.
However, in bigger maps, the fleet mission optimizer can handle
larger number of vehicles as well.
Note: In the video, all nodes are
shown in cyan color, in order to make the positions of the
vehicles clearer.
The topological map used when
generating the videos. Terminals are shown in red, pause nodes
in yellow, and transit nodes in blue.
Note that the only prioritized terminal is the one at the
upper left corner of the image.
Last update:
20180312, 08.00